| University | Temasek Polytechnic (TP) |
| Subject | Certificate in Business Analysis |
OBJECTIVE OF THE ASSIGNMENT
1. To apply the concepts of descriptive statistics and inference statistics through the application of appropriate statistical methods on a case scenario and draw appropriate conclusions. (Units 1 – 8).
Hire a Professional Essay & Assignment Writer for completing your Academic Assessments
Native Singapore Writers Team
- 100% Plagiarism-Free Essay
- Highest Satisfaction Rate
- Free Revision
- On-Time Delivery
CASE STUDY
2. Driven by his passion for food and his “You Only Live Once” attitude, David decided to give up his full-time office job to become a hawker some years ago. David started his first Mala Hotpot hawker stall in Bedok.
Two years later, he started his second Mala Hotpot hawker stall in Jurong. Both stalls sell identical food with the same pricing and operating hours. All his business decisions are made based on his gut feel.
3. Recently, you met David who was once your close friend from your secondary school days. David heard that you are taking a Business Program diploma and he seek your assistance to give him some professional inputs into his existing business. You agreed to help.
4. To help with your analysis, you asked David to track the daily revenue collected and the number of customers served at both hawker stalls for 3 months. At the end of the
3 months, David sent the details of this information to you in a data file to your chat in MS Team. Apply all the statistical concepts and tools that you have learnt from Unit
1 – 8 to help him answer the following questions:
Question 1
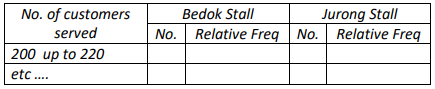
a. Construct the frequency distribution for the number of customers served for both Bedok stall and Jurong stall using a class interval of 20 with 200 as the lower limit of the first class. (Use 4 decimal place for relative frequency)
b. Construct a histogram for each stall from the frequency distribution table generated in part a. Comment on the shape of the histogram.
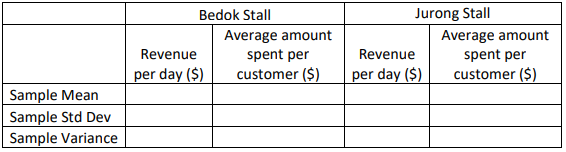
c. Calculate the sample mean, sample variance and sample standard deviation for the following measures shown in the table below.
(Suggest to use 4 decimal places)
Question 2
“Based on his gut feel, David assumed that as more customers are served each day, more revenue would be earned each day too.”
a. From the above statement, identify the independent and dependent variable.
b. Based on David’s assumption, what is the type of relationship that you expect from the 2 variables you identified in part (a). (2 marks)
c. Plot scatter diagrams for the 2 variables identified in this relationship for each stall. Use the scatter diagram to either support or refute the assumption made by David.
Question 3
a. David is wondering if the daily revenue at his Bedok stall is dependent on the average amount spent per customer. Can you determine whether David is correct? Use the appropriate correlation analysis techniques to help David to verify this.
b. David would now like to develop a linear regression model that helps him to determine the daily revenue for his Bedok Stall. Construct a linear regression equation for the Bedok Stall and explain the value of b in the equation statistically.
c. Using the linear regression equation constructed in part (b), estimate the daily revenue if the average amount spent per customer is $8.50.
Question 4
Based on some market research information, the population mean amount that each customer spent per visit on Mala Hotpot at the hawker stall is $8.60. David would like to reward his staff operating the stalls if they can get customers to spend more per visit.
He is prepared to give a reward of $500 for each staff if the average amount spent per customer for the month is more than $9.00. However, he is unsure if this is a realistic target that will motivate the staff. Help David by calculating the following:
a. What is the probability for staff operating the Bedok stall to get the reward?
b. What is the probability for staff operating the Jurong stall to get the reward?
Question 5
According to David, another Mala Hotpot stall operates within the same vicinity as his Bedok stall. This Mala Hotpot stall which sells identical food and has similar pricing, is in direct competition with David’s Bedok stall.
His competitor has been boosting that his Mala Hotpot business is generating $2200 of revenue daily. David is unsure whether to believe him or not. Construct the 98% confidence interval for population mean daily revenue for the Bedok Mala stall.
Is there any grounds to doubt the claim made by David’s competitor? Explain statistically.
Question 6
David believes that the Jurong stall is making more than $2080 of revenue daily. At the 5% level of significance, can you agree with the claim made by David?
Question 7
Summarise your findings to share with David.
Buy Custom Answer of This Assessment & Raise Your Grades
Do you always feel that there is not enough time to take care of all your Certificate in Business Analysis Assignment tasks? Singapore Assignment Help has set a team of professional writers who have gain years of experience to write perfect quality ICT223 Business Analysis Assignment Sample, business management assignment solution at an affordable price. so hurry and contact us today.

Looking for Plagiarism free Answers for your college/ university Assignments.
- CH2123 Assignnment : Fugacity, VLE Modeling & Henry’s Law Applications
- BAFI1045 Assignment -Constructing and Evaluating Passive and Active Portfolios Based on the Straits Times Index (STI)
- PSB501EN Assignment 1: Engineering Systems Integration: A Multi-Technique Approach to Mechanical Analysis
- FIN2210E/FIN2212E Group Assignment: Financial Risk Management Analysis of Bursa Malaysia Companies
- FLM101 Assignment: A Cinematic Dissection: Stylistic Elements and Their Thematic Significance
- Assignment: Transforming Talent in the AI Era: From War to Wealth through Ecosystem Innovation
- COMP 1105 Assignment: Health-Focused E-Commerce Website: A Web Technologies Project Using HTML5, CSS, and JavaScript
- Assignment: Machine Learning in Robo-Advisory Services: Evolution, Applications, and Future Trends
- OMGT2229 Assignment: Quantitative Forecasting, Economic Order Analysis, and Strategic Sourcing Decision-Making for JB Hi-Fi
- Assignment 2: Corporate Finance and Planning: An In-Depth Financial Analysis of Company