| University | Singapore University of Social Science (SUSS) |
| Subject | BUS107: Quantitative Methods |
Question 1
Upon graduation, with the support of your parents, you have opened an eatery that specialized in selling sandwiches in a shopping mall. Your eatery only sells three variety f sandwiches (X, Y, and Z). Each product earns a profit of $17, $13, and $14 for X, Y, and Z, respectively. You assured your parents that you will strive to earn as much profit as you can.
Each of these sandwiches is made from a different combination of chicken, cheese, and beans, as shown in Table 1-1. The total amount (in units) of Chicken, Cheese, and Beans available per day is 28, 80, and 68 units, respectively.
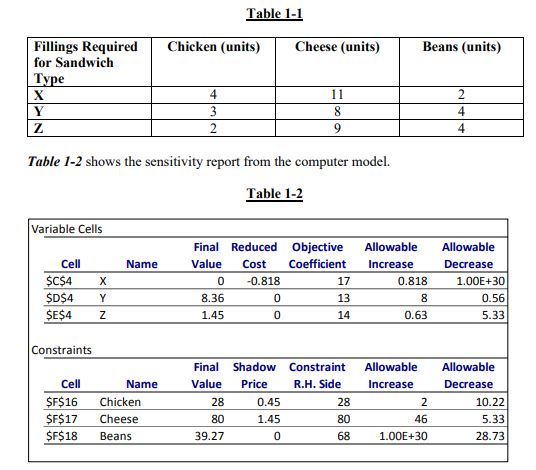
(a) Develop the complete linear programming model that will meet the objective of setting up this shop. Clearly state the variables, objective function, and constraints.
(If you need to draw a diagram or figure (and cannot do so in MS Word), take a picture of the image you have drawn and insert it in your answer. You are reminded that the overall file size of your submission of this TOA should not exceed 500MB. For a table, you are advised to copy the table given in the question or draw it in MS Word. For an equation, you are advised to write the equation in MS Word.)
(b) Your parent noticed that you are running low on supply and offer to help you purchase additional Chicken, Cheese, and Beans on their way to the supermarket. How would you respond?
(c) Suppose your parent suggested you increase the price of the X product by about 80 cents. Comment on their suggestion.
Hire a Professional Essay & Assignment Writer for completing your Academic Assessments
Native Singapore Writers Team
- 100% Plagiarism-Free Essay
- Highest Satisfaction Rate
- Free Revision
- On-Time Delivery
Hire a Professional Essay & Assignment Writer for completing your Academic Assessments
Native Singapore Writers Team
- 100% Plagiarism-Free Essay
- Highest Satisfaction Rate
- Free Revision
- On-Time Delivery
Question 2
Your colleagues are planning a recreational activity for Friday evening as part of staff bonding and have constructed the following payoff table (Table 2-1) to aid their decision making. Assume that the payoffs represent their level of enjoyment for each activity under the various weather conditions.
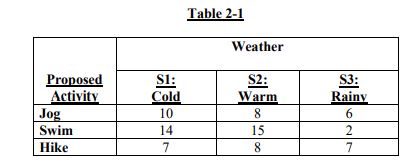
(a) Explain which proposal your colleague should choose according to the Minimax Regret Approach. Show your Opportunity Loss Table.
(b) Another colleague from the analyst team has downloaded weather reports for the past 3 years and based on his analysis, there is a 30% chance of experiencing cold weather and a 35% chance each for warm and rainy weather.
Based on Expected Value Approach, explain which proposed activity should your colleague choose, and calculate the Expected Value of Perfect Information (EVPI).
Question 3
A Singapore-based company, as part of its corporate social responsibility, has announced its commitment to fund the construction of a sheltered walkway at an old estate in Singapore. Table 3-1 shows the distance of the existing walkway between the 7 blocks within the estate. It costs $100 per meter of sheltered walkway built.
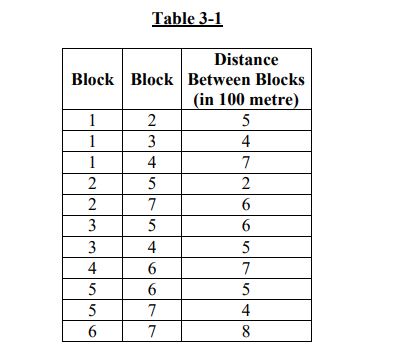
(a) Draw the network diagram depicted by Table 3-1 in your answer booklet.
(b) As a member of the project team, you have been tasked to solve for the least cost network with the objective of having all the blocks connected.
Then state the total distance required to be sheltered and the total cost involved.
Question 4
A local shopping mall loans out baby strollers to shoppers in order to enable shoppers with young children to have a better shopping experience. Due to limited space available at the concierge counter where the baby strollers are loaned and returned, it could only hold 3 baby strollers. The mall management conducts a simulation study to further understand the stroller’s utilization.
The time between successive arrivals of shoppers seeking to loan the baby stroller at the concierge is as shown in Table 4-1. The probability of stroller usage time is given in Table 4-2.
Assume that the concierge counter opens at 11:00 A.M. and the first arrival is after this, based on the first inter-arrival time generated.
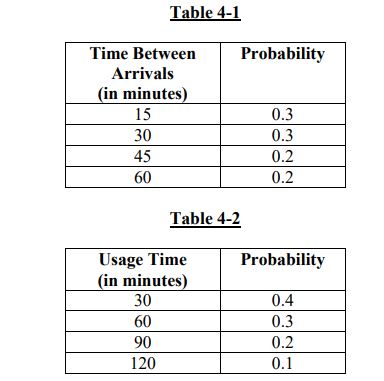
(a) Identify the corresponding interval of random numbers (in decimals) for “Time Between Arrivals” and “Usage Time” using the probability information given in Table 4-1 and Table 4-2, respectively.
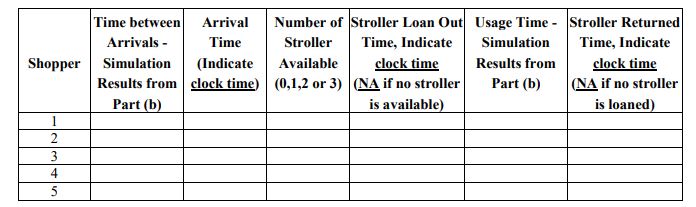
(b) Using the interval in Part (a), simulate the following 5 shoppers experience in loaning the baby strollers using the corresponding random numbers:
i. Time Between Arrivals: 0.22, 0.67, 0.28, 0.73, 0.16.
ii. Usage Time: 0.31, 0.97, 0.72, 0.26, 0.91
(c) Using the result in Part (b), simulate the loaning of baby strollers for the 5 consecutive shoppers using this table (copy the same table in your answer booklet) and interpret the result (in particular for a situation(s) when a baby stroller is not available when the shopper arrives at the concierge). If no stroller is available at arrival, customers will leave without the loan.
Our expert assignment writers are available here at Singapore Assignment Help to help you. They provide help to SUSS university students who want help for (BUS107) quantitative methods assignments. Our experts offer the best online assignment help services at a very reasonable price. Download our free assignment sample of quantitative methods now.

Looking for Plagiarism free Answers for your college/ university Assignments.
- INDIVIDUAL RESEARCH PROJECT: MERGERS AND THEIR IMPACT
- PSS388 End of Course Assessment January Semester 2025 SUSS : Integrated Public Safety And Security Management
- PSY205 Tutor-Marked Assignment 02 SUSS January 2025 : Social Psychology
- Math255 S1 Assignment-2025 SUSS : Mathematics for Computing
- BUS100 Tutor-Marked Assignment January 2025 SUSS : Business Skills And Management
- CSCXXX SUSS : New System Development Using Java : Soft Dev Pte Ltd Project
- Cloud Computing: Fundamentals, Networking, and Advanced Concepts
- COS364 Tutor-Marked Assignment January 2025 Sem SUSS : Interventions for At-Risk Youth
- FMT309 Tutor-Marked Assignment 01 SUSS January 2025 : Building Diagnostics
- HBC203 Tutor-Marked Assignment 01 January 2025 SUSS : Statistics and Data Analysis for the Social and Behavioural Sciences