| University | Singapore University of Social Science (SUSS) |
| Subject | BUS352: Operations Analytics |
Question 1
EverydayBuy.com is an online B2C platform that helps manufacturers market and sell their products directly to end consumers. If a consumer purchases a good from a seller on EverydayBuy.com and finds a quality problem within 7 days after receiving it, the platform provides returns service at the seller’s charge, so that the faulty good can be returned to the seller. The platform is interested in understanding the characteristics of sellers with low return rates.
The platform collects the following information of 87 sellers for analysis. The information is collected for the four-month period of September 2024 to December 2024.
• Number of returns: Number of units of transacted goods being returned from customers.
• Type: Category A, B and C of goods.
• Inventory turnover: the average inventory turnover.
• Sales size: the number of units of goods transacted.
• Year: the number of years for which a seller has engaged with the platform.
Data are included in Appendix 1. The platform considers a return rate of 6% or below being acceptable. The platform intends to construct a predictive model for product return analysis and use Logistic regression to examine the sample data.
(a) Define Return Rate as the percentage of goods being return from end consumers. Use the information in the data set to calculate the return rate for each seller. Use the calculated return rate information in the following analysis.
(5 marks)
(b) Use the “Return Rate” information and the platform’s criterion of an acceptable return rate to construct a binary dependent variable. Treat “Type”, “Inventory Turnover”, “Sales Size”, and “Year” as explanatory variables. Note that you need to transform the categorial value “Type” into numerical variables. Provide details how these variables are constructed if necessary. Assign a notation to each variable and use these notations to
explicitly write out the logistic response function.
(13 marks)
(c) Use Microsoft Excel add-in (or online tools) to run Logistic regression on the sample data. Show the regression output. Construct the Logistic regression function based on the regression output. Which variable(s) is(are) statistically significant at the 0.05 level? What do the regression results suggest?
(Word count: 250)
(17 marks)
(d) Based on the Logistic regression function in Q1(c), compute the predicted probability of a seller with an acceptable return rate given that the seller sells category A good, has an inventory turnover of 7.2, a sales volume of 1,400 units, and has engaged with the platform for 6.8 years. Show your calculation details.
(5 marks)
(e) Given a threshold of 0.8, what are the number of True Negatives (TN), False Positives (FP), False Negatives (FN) and True Positives (TP)? What is the accuracy of the predictive model? Show your calculation details.
(10 marks)
Hire a Professional Essay & Assignment Writer for completing your Academic Assessments
Native Singapore Writers Team
- 100% Plagiarism-Free Essay
- Highest Satisfaction Rate
- Free Revision
- On-Time Delivery
Question 2
A firm produces portable electricity generators and makes the following demand forecasts in a 6-month period as shown in the table below. “Demand” refers to the quantities of product ordered by customers in a month, and “days” refer to the number of working days in a month.
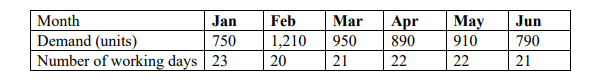
The firm currently has nine (9) full-time workers in its production site. A productivity analysis shows that on average, one worker can produce four (4) units of product per working day.
On average, one unit of product generates a revenue of $390. The average material cost of one unit of product is $127. The average salary for a worker is $6,700/month. If overtime is used, the average overtime payment is $500 per day for each worker. HR policy mandates that the total overtime of 11 workers cannot exceed 13 days per month.
The firm can consider using subcontractors. However, subcontractors can only accept orders in multiples of 50 units, i.e., the order size should be of 50, 100, etc. The maximum order that subcontractors can accept is 200 units per month. Subcontractors charge the firm the following unit price based on the order size.
| Order size | Unit Price |
| 50 units | $370 |
| 100 units | $347 |
| 150 units | $332 |
| 200 units | $324 |
Unfulfilled demands are considered as backorders, and the estimated backorder cost is $117 per unit of product per month. Unsold finished products are stored in the warehouse and incur inventory holding cost of $31 per unit per month. The warehouse can accommodate a maximum of 300 units of finished product inventory. Assume that the initial inventory of
finished products at the beginning of January is 150 units.
As an operational analyst, you are expected to develop an aggregate plan to guide the firm’s production and subcontracting decisions. Note that in the following analysis, you are NOT supposed to follow either Chase or Level strategies.
Buy Custom Answer of This Assessment & Raise Your Grades
(a) Formulate the above planning problem into an optimisation problem. You can take reference from Appendix 4.1, Study Unit 4. You should do the following:
(i) State the assumptions and provide justifications if necessary. Note that assumptions are needed for revenue/cost calculations and for the construction of constraints.
(Word count: 200)
(6 marks)
(ii) State the decision variables, objective and constraints. Use proper notations to denote decision variables and related parameters.
(Word count: 400)
(18 marks)
(iii) Use notations in (ii) to construct the objective function and constraints according to the standard optimisation problem formulation.
(Word count: 200)
(9 marks)
(b) Use Microsoft Excel Solver to solve the optimisation problem and answer the following questions.
(i) Select the appropriate solving method and provide justification. Show the Solver setup and solve the optimisation problem. Show Excel Solver output as the solution.
(Word count: 150)
(9 marks)
(ii) Based on the output, what is the company’s aggregate plan (which should look like Table 4.9 in Appendix 4.1, Study Unit 4) for the 6-month period? Are there any months with overtime, inventory holding cost, backorder cost, and subcontract cost? What is the objective function value?
(8 marks)
Note: For details of data analysis related to Questions 1 and 2, you are required to embed one
(1) Microsoft Excel spreadsheet (not screenshots, but the *.xlsx file) at the end of the Word document as an appendix for verification purpose. Please test and make sure the embedded spreadsheet can be opened properly. A mark deduction penalty may be applied if the Excel worksheet is not included or cannot be opened properly.
If you want to know how to embed a file in WORD, please find the following link for helpful information:
https://support.microsoft.com/en-us/office/insert-a-chart-from-an-excel-spreadsheet-intoword-0b4d40a5-3544-4dcd-b28f-ba82a9b9f1e1
Stuck with a lot of homework assignments and feeling stressed ? Take professional academic assistance & Get 100% Plagiarism free papers

Looking for Plagiarism free Answers for your college/ university Assignments.
- Liam’s Employment Status & Contractual Obligations at Eclipse Marketing : SUSS
- PSB6014CL Individual Written Report Coventry University January 2025 : Project Management
- BUS356 Group-based Assignment January 2025 Semester : Business Negotiation
- TZU CHI SCHOOL Term 3 Argumentative Essay Assessment 2024-25 : Historical Accuracy of ‘The Boy in the Striped Pajamas’
- PSB6012CL Course Work :Business Research Methods Key Approaches and Applications
- Article : Cell Biology and Molecular Regulation Rb–E2F Activity and Proliferation Commitment
- Workplace Law Assignment: Employment Status and Contractual Obligations
- Management Foundation Studies: Individual Assignment 2 Accounting & Business Finance SIM Global Education
- HRM335 Tutor-Marked Assignment (TMA01) January 2025 SUSS : Leadership Development
- INDIVIDUAL RESEARCH PROJECT: MERGERS AND THEIR IMPACT