| University | The Royal Melbourne Institute of Technology (RMIT) |
| Subject | BUSM 4554: Basic Econometrics |
QUESTION 1)
We model the salary of the average inhabitant of Pinkland. Salaries are a function of education (expressed in years), working hours (expressed in hours), firm sales and sector. There are 3 sectors in Pinkland, namely agriculture, industry and service.
Salaries are expressed in pinkies (currency of Pinkland). The model is estimated as follows:
Log(salary) = 1.2+ 0.08*educ+ 0.6*log(hours) + 0.16*log(sales) + 0.37*industry +0.56*service N=800
R2 = 0.78
- Interpret the coefficient on education. What type of relationship is this?
- Interpret the coefficient on “hours” and “sales”. What type of relationship are these?
- We have 3 categorical variables in the regression. Which is the base category?
- Interpret the coefficient on “industry” and “service”.
- Interpret the R2. Is this high enough in your opinion?
Don’t forget: Log referrers to natural logarithm!
Hire a Professional Essay & Assignment Writer for completing your Academic Assessments
Native Singapore Writers Team
- 100% Plagiarism-Free Essay
- Highest Satisfaction Rate
- Free Revision
- On-Time Delivery
QUESTION 2
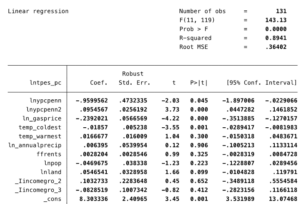
We model energy use per capita of 131 countries in a given year as follows:
Lntpes_pc =
The variables are defined as follows:
Lntpes_pc = log of total primary energy consumption per capita (ktoe)
Lnypcpenn =log of GDP per capita (USD)
Lnypcpenn2 = square of log of GDP per capita (USD)
Ln_gasprice = log of pump price for gasoline (USD/liter)
LnAnnualprecip= log of annual precipitation (mm)
Temp_coldest = average temperature for the coldest month in a year (in C)
Temp_warmest= average temperature for the warmest month in a year (in C)
ffrents = Fossil Fuel Rents (% of GDP)
LnPop = log of population (in millions)
LnLand = log of land area (in km2)
I_Incomegroup = refers to income groups “1”, “2” and “3”, low, mid and high-income countries.
*” Log” always refers to natural logs or “ln” here.
Log referrers to natural logarithm!
- Interpret the constant and its p-value.
- Interpret the coefficient on gas price and its p-value.
- Interpret the coefficient on annual precipitation and carry out a t-test to determine the significance of the coefficient.
- Interpret the coefficient on population and its p-value.
- The above model belongs to the class of nonlinear equations. Calculate the turning point of the nonlinear relationship.
- Is this a U-shaped or inverted U-shaped relationship?
- Analyse the relationship between energy use per capita and GDP pc based on these insights. How does energy use per capita change with GDPpc? Prepare a graph!
- Please define MLR 2 and describe if MLR 2 is likely to hold or not?
- Please define MLR 4 and describe if MLR 4 is likely to hold or not?
Critical values for the standard normal distribution (z)
| Confidence level
(1-α) |
Level of Significance
(α) |
Two-Sided Critical Valuecα/2 |
One-Sided, Upper-TailCritical Valuecα |
One-Sided, Lower-TailCritical Value-cα |
| 90% | 10% | 1.645 | 1.28 | -1.28 |
| 95% | 5% | 1.96 | 1.645 | -1.645 |
| 99% | 1% | 2.58 | 2.33 | -2.33 |
Buy Custom Answer of This Assessment & Raise Your Grades
Are you Facing trouble to finish BUSM 4554: Basic Econometrics Assignment? then hire assignment buddy service at Singapore Assignment Help. We have highly educated and talented experts who are always ready to craft quality solutions on economic assignments at a cheap price.

Looking for Plagiarism free Answers for your college/ university Assignments.
- HRM331: Talent Management – Strategic Shift from the War for Talent to the Wealth of Talent
- Marginalised Populations – The Structural and Cultural Exclusion of People Experiencing Homelessness in Singapore
- CVEN3501 Assignment 2: Groundwater Modelling of Drawdown from a Pumping Bore
- CSCI312 Assignment 2: Conceptual Modelling and Implementation of a Data Warehouse and Hive Queries
- CH2123 Assignnment : Fugacity, VLE Modeling & Henry’s Law Applications
- BAFI1045 Assignment -Constructing and Evaluating Passive and Active Portfolios Based on the Straits Times Index (STI)
- PSB501EN Assignment 1: Engineering Systems Integration: A Multi-Technique Approach to Mechanical Analysis
- FIN2210E/FIN2212E Group Assignment: Financial Risk Management Analysis of Bursa Malaysia Companies
- FLM101 Assignment: A Cinematic Dissection: Stylistic Elements and Their Thematic Significance
- Assignment: Transforming Talent in the AI Era: From War to Wealth through Ecosystem Innovation