| University | Singapore University of Social Science (SUSS) |
| Subject | MTH220e: Statistical Methods and Inference |
Question 1
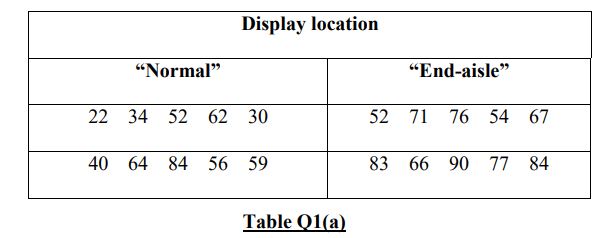
(a) The sales manager of ABC supermarket would like to investigate whether the type of display locations used in the supermarket affects the sales of the product. A two-sample t-test is carried out to determine whether the mean weekly sales of the product are the same when using a “normal” shelf location, as compared to using an “end-aisle” display. He selected 20 stores from the supermarket chain and randomly assign 10 of the 20 stores to sample 1 and 10 stores to sample 2.
The supervisors of the 10 stores in sample 1 placed the products in the “normal” shelf location, whereas the supervisors of the other 10 stores in sample 2 placed the products used the “end-aisle” display. At the end of one week, product sales are recorded in Table Q1(a).
(i) Formulate the null and alternative hypotheses.
(ii) At α = 0.05, perform a two-sample t-test to determine whether there is strong evidence to support the claim that the true mean weekly sales of products are the same when using different display locations.
(iii) Apply and construct a 95 % confidence interval on the difference in mean weekly sales of products using the “normal” location and the “end-aisle” location.
(b) What is the difference between the Pearson correlation coefficient and Spearman rank correlation coefficient? Briefly discuss the advantage(s) of the Spearman rank correlation coefficient over the Pearson correlation coefficient.
Question 2
(a) Consider the same data depicted in Table Q1(a) above. Suppose the sales manager decided to use a non-parametric approach to determine whether the mean weekly sales of the product are the same when using a “normal” shelf location, as compared to using an “end-aisle” display. Using normal approximation, perform a Mann-Whitney test at a 5 % level of significance. Comment on your results.
(b) Samples of steel pre-stressing cables to be used in a curved gravity dam are tested prior to construction to ensure that the shipment meets the design capacity. Design plans call for cables with a mean capacity of at least 900 kips. A total of 8 samples were randomly selected and tested, with the following capacities: 825,900, 915, 850, 870, 930, 835, and 885 kips. If these cables selected for testing are representative of the cables supplied by the manufacturer, perform a suitable hypothesis test at 5 % level of significance, and discuss whether the design capacity is met.
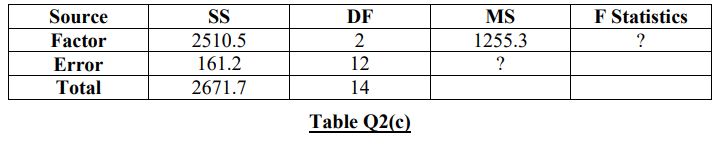
(c) Determine the missing values in the one-way ANOVA in Table Q2(c).
Hire a Professional Essay & Assignment Writer for completing your Academic Assessments
Native Singapore Writers Team
- 100% Plagiarism-Free Essay
- Highest Satisfaction Rate
- Free Revision
- On-Time Delivery
Question 3
Consider the Geiger counter experiment to demonstrate the phenomenon of radioactivity. The number of alpha particles emitted from a Polonium source during 2608 different intervals of 7.5 seconds duration is investigated. The number of time intervals in which 0, 1, 2, 3, 4, … etc particles had been observed is shown in Table Q3 below. For example, in 57 of these intervals, there were zero emissions. In 203 of these intervals, there was a single emission. Let X denotes the number of particles hitting the screen in a single time interval. The observed frequencies Oi gives the observed proportion of time intervals in which x particles hit was recorded.
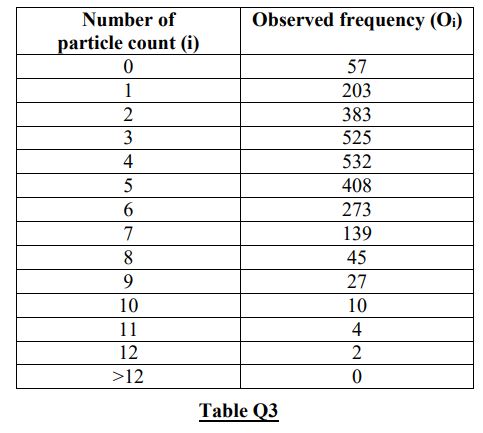
(a) Analyze and compute the sample mean.
(b) Compute and tabulate the expected frequencies.
(c) Apply the chi-squared goodness of fit test to determine whether the Poisson model provides a good fit to these data.
Question 4
(a) The marketing manager of a supermarket chain would like to use shelf space to predict the weekly sales of powder detergents. A random sample of 12 stores is selected with the following results shown in Table Q4(a).
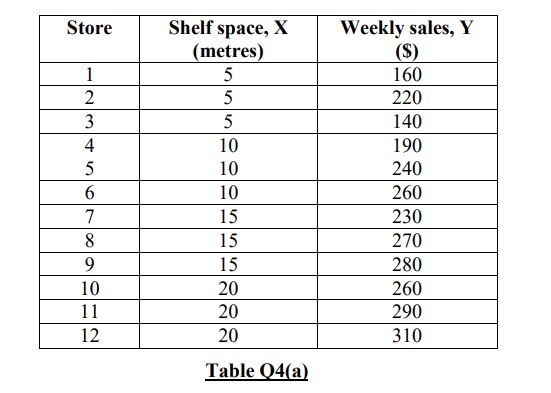
(i) Construct a scatter plot and comment on the results.
(ii) Assuming a linear relationship, use the least-square method to determine the regression coefficients and the linear regression model.
(iii) Predict the weekly sales of powder detergents for stores with 8 meters of shelf space.
(b) A study was conducted to estimate the costs of employee absences. Based on a sample of 176 workers, it was estimated that the mean amount of paid time lost during a three-month period was 1.4 days per employee with a standard deviation of 1.3 days. Suppose that we randomly select a sample of 100 workers. Analyze and compute the probability that the average amount of paid time lost during a three-month period for the 100 workers will exceed 1.5 days.
(c) By analyzing a suitable probability model, compute the variance of the total number of rolls of an unbiased six-sided dice, up to and including the 25th “SIX”.
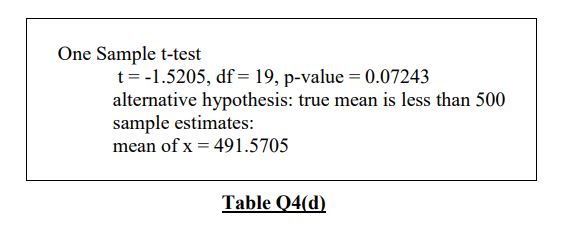
(d) A bottle filling machine is designed to fill bottles with a soft drink to a volume of 500 ml. The actual volume is known to follow a normal distribution. The manufacturer believes the machine is under-filling bottles. A sample of 20 bottles is taken and the volume of liquid inside is measured. Using R commands, suppose a one-sample t-test is carried out to investigate whether the bottles in the production lines are being consistently underfilled, or whether the low mean volume for the sample is purely the result of random variation. A one-sided test is suitable because the manufacturer is specifically interested in knowing whether the volume is less than 500 ml. The null hypothesis is formulated as The mean filling volume is equal to or greater than 500 ml. The alternative hypothesis is set as: The mean filling volume is less than 500 ml. A significance level of 0.01 is used in this test. The R output results are generated in Table Q4(d). Comment on the results.
Question 5
(a) A sample of 1600 transistors of the same type is obtained at random from a manufacturing process in which 8 % of all such transistors produced are defective. Using the normal distribution as an approximation to binomial model, analyze and compute the probability that in such a sample, 150 or fewer transistors will be defective.
(b) A study of gender differences in perception was conducted and one of the tests was of scores in verbal reasoning. Based on the results tabulated in Table Q5(b), we would like to find out whether there is any statistical evidence that the data show a difference in verbal reasoning by gender.
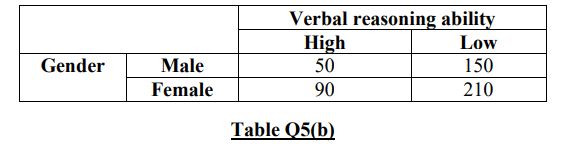
(i) Formulate the null and alternative hypotheses.
(ii) Perform a chi-square test at a 5 % level of significance to determine whether there is an association between gender and verbal reasoning ability.
Our expert assignment writers have a wealth of experience and knowledge in completing statistics assignments for the students of Singapore. They are well versed with the SUSS university standards and write the MTH220e: statistical methods and inference assignment according to the specifications given by your professors. Approach us to get free statistics assessment sample today.

Looking for Plagiarism free Answers for your college/ university Assignments.
- INDIVIDUAL RESEARCH PROJECT: MERGERS AND THEIR IMPACT
- PSS388 End of Course Assessment January Semester 2025 SUSS : Integrated Public Safety And Security Management
- PSY205 Tutor-Marked Assignment 02 SUSS January 2025 : Social Psychology
- Math255 S1 Assignment-2025 SUSS : Mathematics for Computing
- BUS100 Tutor-Marked Assignment January 2025 SUSS : Business Skills And Management
- CSCXXX SUSS : New System Development Using Java : Soft Dev Pte Ltd Project
- Cloud Computing: Fundamentals, Networking, and Advanced Concepts
- COS364 Tutor-Marked Assignment January 2025 Sem SUSS : Interventions for At-Risk Youth
- FMT309 Tutor-Marked Assignment 01 SUSS January 2025 : Building Diagnostics
- HBC203 Tutor-Marked Assignment 01 January 2025 SUSS : Statistics and Data Analysis for the Social and Behavioural Sciences