| University | Temasek Polytechnic (TP) |
| Subject | STA2212E: Analytics For Business |
Instructions:
- You need to type all your solutions using Microsoft Word.
- All analysis needs to be done with Microsoft Excel. You need to copy the Excel output and paste it into Microsoft Word (You DO NOT have to explain how/steps in getting the Excel output)
- You need to name your Microsoft Word file as IndividualAssignment_YourName.docx
Buy Custom Answer of This Assessment & Raise Your Grades
Question 1
The manager of a bank wishes to compare the waiting time of customers during the noon to 1pm lunch period. The table below shows the waiting time (in minutes) of random samples of customers from two different branches of the bank, branch A and branch B.
![]()
The population standard deviation of waiting time for Branch A and Branch B are known to be 1.10 and 0.80 respectively. Test whether the average waiting time of customers from branch A is more than that of customers from branch B at 10% significance level.
Question 2
A factory manager wishes to investigate whether a new processing methods is effective in reducing the time taken by the workers to complete a task. He randomly chose 10 workers to try the new processing methods. The table below shows the time taken by the 10 workers to complete the same task using the old and new processing methods.

Assume that the time taken to complete the task is normally distributed. Test whether the new processing method is effective in reducing the time taken to complete the task by the workers at 5% significance level.
Hire a Professional Essay & Assignment Writer for completing your Academic Assessments
Native Singapore Writers Team
- 100% Plagiarism-Free Essay
- Highest Satisfaction Rate
- Free Revision
- On-Time Delivery
Question 3
A random sample of 200 customers was asked about their preferred brand of 3-in-1 instant coffee as follows.
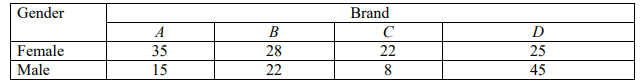
Test whether there is an association between gender and the preferred brand of 3-in-1 instant coffee. Use 5% significance level.
Question 4
An agent for a residential real estate company in a large city would like to predict the monthly rental cost (measured in thousands of dollars) for apartments based on the size of apartment (measured in square feet). A sample of 10 apartments was selected and the information needed is shown in the table below.
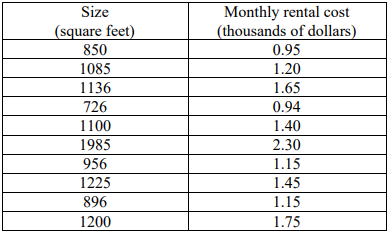
(a) Plot a scatter diagram for the above data.
(b) Perform the regression analysis for the above problem. Show your Excel output of the analysis.
(c) Find the simple linear regression equation that can be used to predict the monthly rental cost based on the size of apartment. Give your coefficients in 4 decimal places.
(d) Interpret the slope of your regression equation in part (c).
(e) Find and interpret the coefficient of correlation.
(f) Find and interpret the coefficient of determination.
Stuck with a lot of homework assignments and feeling stressed ? Take professional academic assistance & Get 100% Plagiarism free papers

Looking for Plagiarism free Answers for your college/ university Assignments.
- SOC367 Gender Equality in the Philippines and the Magna Carta for Women – ECA Essay
- HBC251 Religious Hate, Violence, and Inter-Religious Relations: A Sociological Analysis – ECA
- Leadership Responses to Environmental Turbulence Using Yukl’s Leadership Matrix
- Financial and Investment Analysis Report – Economic Trends, Risk Assessment, and Strategic Growth Potential
- BUS363 Total Quality Management Analysis of Ride-Hail Services in Singapore – ECA
- BUS353 Air Taxi System Project Management Case Study – ECA
- BUS356 Ethical Justification for Delaying Catalisten’s Launch Due to Bias
- HRM335 Thought Leadership Analysis: Leadership Styles, Impact & Competencies
- HBC101 Singapore’s FWAs: Addressing Aging, Talent Shortage & Mental Health – TMA01 Essay
- HRM358 Addressing Hiring Bias and Promoting Diversity – ECA